


UPDATE: On July 1, 2024 you will no longer be able to access historic data about your website from Universal Analytics properties.
With the retirement of Google’s Universal Analytics looming and the age of its successor, Google Analytics 4 (AKA GA4), now in full swing, there’s no time like the present to begin preparing your business for the new age of data analytics.
With the deadline on the horizon, a year may sound like a long time - but in the fast-paced world of digital, it’ll be here in the blink of an eye. So, to help you hit the ground running, it’s crucial to begin the all-important process of migrating your business analytics over to GA4. If you’d like to learn about how to extract and store your data, get in touch with us today.
If you need some help putting the wheels in motion - or even knowing where to start on your migration journey - we’ve put together a comprehensive guide to GA4 migration so you can gain an understanding of this powerful new platform and why early adoption is the way to go.
- What is Google Analytics 4 and how does it differ from Universal Analytics?
- Why is Google Analytics 4 replacing Universal Analytics?
- How long does Universal Analytics have left?
- When to migrate and why
- The Google Analytics 4 report structure
- How to find your favourite Universal Analytics dimensions, metrics and tools in Google Analytics 4
- Are we migrating for better or worse?
- How to make the move to Google Analytics 4
What is Google Analytics 4 and how does it differ from Universal Analytics?
Google Analytics 4 is, as you might’ve guessed, the fourth version of Google Analytics - succeeding its two previous iterations, the asynchronous code and everyone’s favourite, the long-reigning Universal Analytics.
Google Analytics 4 is designed to integrate data from both mobile apps and websites in one convenient cross-device report. In the past, data from these two platforms was gathered separately (via Universal Analytics for website data and Google Analytics for Firebase for mobile app data).
In the new GA4 platform, website and app usage data can be tracked in a single property for more cohesive, streamlined and accurate reporting. In real life, this can mean data gaps for brands that track app and website data separately.
For example, with the current method, a user may visit a website to browse, but end up making their purchase via an app, as a result the app would be considered the superior touch point with users.
With new GA4 tracking, you will be able to identify that the user journey started with them browsing on their desktop and ended in them making their purchase through an app.
Since October 2020, all new properties have been set up in GA4, while Firebase apps have been automatically upgraded to GA4.
With existing Universal Analytics properties, it’s possible to upgrade to GA4 early and maintain data processing within UA while you plan and implement your migration to GA4. This will allow you to run the two properties alongside each other to ensure your data is being accurately tracked before you make the permanent switch.
Be aware that these UA properties will eventually become obsolete when the platform ceases to generate new data. For unprepared businesses, this could mean valuable historical data from UA properties being lost forever (shriek!).
One of the key differences between Universal Analytics and Google Analytics 4 is the shift towards a more agile, event-based model. The new GA4 events are designed to track the whole customer journey, as opposed to UA’s session-based model which tracks activity within a certain timeframe (or session).
This event-based model works by counting every interaction as its own event, meaning these events won’t be confined to a specific session. Users will be able to send up to 500 individual events to Google Analytics 4, each of which can have up to 25 additional parameters. This far exceeds the current Category, Action, Label and Value attributes offered in Universal Analytics. As a result, users have access to far more granular and insightful data sets with GA4.
GA4 also differs in how it presents data. Those familiar with Google Analytics for Firebase will notice some similarities given that it’s built on Firebase analytics - but for UA users, there are some fundamental differences in how data is presented.
In GA4, many of the separate reports found in UA have been combined and displayed in widgets in one overview section. This is designed to provide a user-friendly, at-a-glance alternative to UA’s table-heavy reports - instead giving users a digestible overview of key metrics.
More in-depth insights on a given metric can be accessed by clicking into the scorecards, making it significantly easier to access important data and identify potential issues or trends.
We’ll go into more detail on GA4’s reports in our section on the new structure later in this post.
Why is Google Analytics 4 replacing Universal Analytics?
One of the primary objectives for Google Analytics 4 is future-proofing data gathering - moving away from UA’s current reliance on cookie consent data.
Using AI machine learning, GA4 works to fill data gaps where cookie consent tracking isn’t provided following the introduction of GDPR. As a result, GA4’s model is far more stable and scalable for a future with or without cookie consent.
This also places more emphasis on tracking the complete customer journey rather than breaking this down into interactions such as session, device and platform.
The result is more holistic, accurate data reporting which can help businesses better understand their customers’ journeys and online behaviour.
How long does Universal Analytics have left?
Google Analytics 4 has been available since October 2020 - but earlier in 2022, Google announced it would be retiring Universal Analytics and that Google Analytics 4 would become the new gold standard for tracking website and app usage.
As of 1st July 2023, Universal Analytics will cease processing new website data, moving over solely to GA4.
For premium Universal Analytics 360 account users, you’ll have a few extra months to prepare for GA4 migration - with new data processing ceasing on 1st October 2023.
When to migrate and why
The migration deadline may seem like a long way off yet, making it easy to convince yourself you have more than enough time to get everything sorted. The reality is that the end of this era of Google Analytics will roll around before you know it, and the migration process is a fair bit more complex than simply upgrading your properties from UA to GA4.
The meaningful differences between how data is tracked and presented can lead to worrying gaps in your data if you don’t take the time to iron out the various kinks. For that reason, it makes sense to begin the migration process early, putting strategies in place ASAP to maximise your chances of a smoother transition overall.
Early adoption doesn’t have to mean losing access to your Universal Analytics data sooner, though - GA4 and UA properties can live harmoniously alongside each other, both gathering data, until 30th June 2023.
Implementing simultaneous data gathering on GA4 and UA gives you the opportunity to start gathering data early, giving you more comparative data for when the full switchover is made.
What are the advantages of this? Well, in the immediate, you won’t lose sight of your key metrics, which certainly doesn’t hurt. Long-term, you’ll give yourself plenty of breathing room to resolve any data discrepancies between the two platforms.
The other reason to migrate early is to make sure you don’t lose historical data from UA. Universal Analytics will still allow you to access this previously processed date 6 months after 1st July 2023, but it won’t process any new data once the new GA4 platform becomes the sole data source.
Working ahead will allow you to plan and implement a way to export historical UA data for future use, making sure you can draw as much value from these data sets as possible when it comes to identifying trends and anomalies.
The Google Analytics 4 report structure
The key thing you need to know about Google Analytics 4’s report structure is that, unlike Universal Analytics, it’s built around the customer life cycle. The structure follows the journey chronologically from initial user acquisition to engagement, monetisation and, ultimately, retention.
In this way, GA4 provides valuable insight into how your customers engage with your brand over the course of their relationship with you, and the many, many interactions that comprise this relationship.
Here, we’ve broken down the structure of GA4’s reports and the sorts of data you can access within each of these shiny new dashboards.
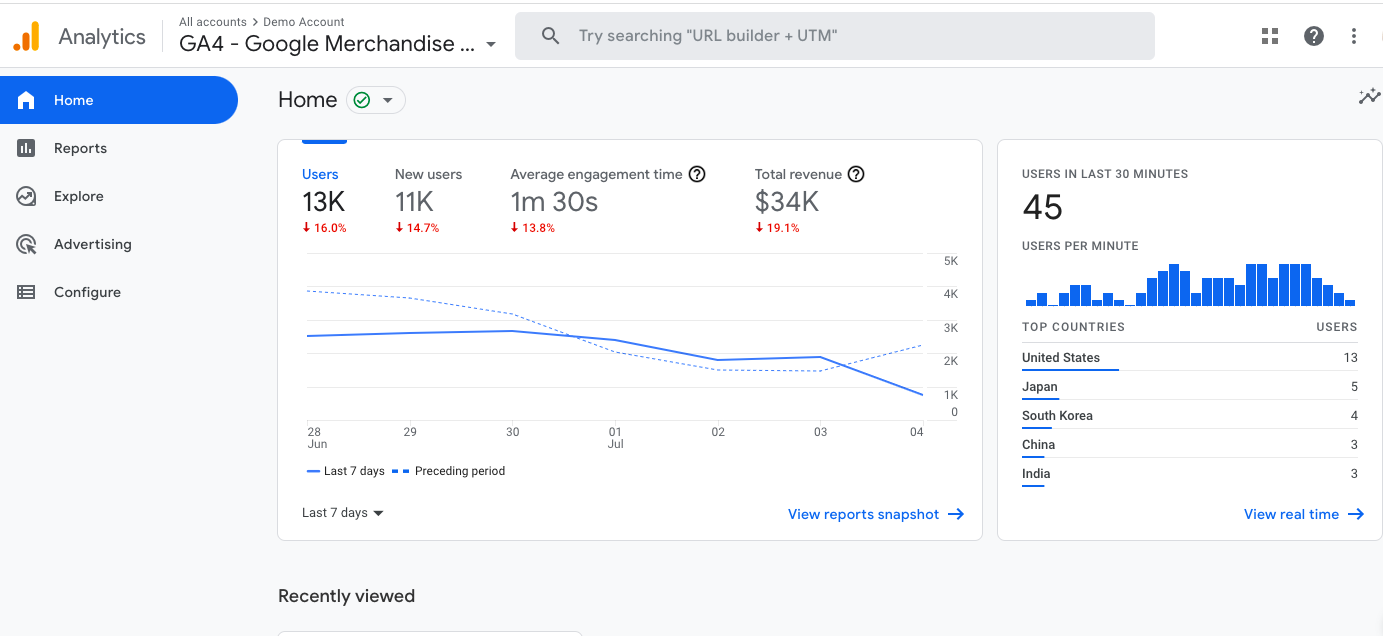
Home
Similarly to Universal Analytics, this area of Google Analytics 4 shares the high-level data you need at first glance. As standard, this includes users, new users, average engagement time, total revenue and user data by location.
The Home area is fully customisable so you can display the metrics that are most important to your business here. It also pulls through quick links to your most recently viewed reports so you can access these instantly upon arriving at GA4.
Last but by no means least, the Home dashboard displays a range of useful insights gathered via Google’s machine learning magic - arming you with emerging data trends and more based on your business’s unique data.
Reports
This primary area of GA4 is broken down into various logically named subsections to make it quick and convenient to access your favourite metrics on a regular basis. Think of this area as the home of all of your business’s user and events data.
Reports snapshot
This first tab of the Reports area provides an at-a-glance snapshot of your core metrics from across the various report types - like a smorgasbord of your business’s top-level data.
Examples of data you’ll find in here include:
- Users and new users
- Average engagement time
- Total revenue
- Top channels and campaigns
- User location data
- User activity and retention
- Top pages and events
- Top conversions and products
Elements of these various widgets can be customised to reflect the specific dimensions and metrics you most want to see - and each has a quick link link to the full version of the relevant report for deeper digging.
Realtime
This tab provides up-to-the-minute data on user locations using Identity Spaces. These are types of identifiers that connect user identities across multiple devices and platforms - something UA struggled to provide previously.
With GA4, this activity data links up multi-device and platform identities to give GA4 users greater insight into the complete customer journey.
In terms of day-to-day use, your Realtime report will be a trusty companion for testing tracking and measurement internally, ensuring users, events and conversions are being accurately recorded.
For instance, if a brand knows their customers generally use multiple devices during their buying journey, but they struggle to track cross-device sessions in UA, GA4's cross-device data will come to the rescue.
Life cycle
This group of reports works together to give you an understanding of user behaviour from initial acquisition through to conversion and long-term retention.
The Life cycle area is broken into four distinct sections, each of which focuses on a discrete stage of the user journey - essentially helping you to dig deep into each portion of the sales funnel.
Acquisition
This is where it all starts: the Acquisition report, which shows where your traffic originates - including traffic channels, sources, mediums and campaigns.
You’ll be familiar with all of these dimensions having used Universal Analytics, and you’ll be pleased to know these are all easily accessible within GA4’s Acquisition report.
Here’s a breakdown of the subsections contained within this report:
- Acquisition overview: find your top-level acquisition data here, including users and new users, location data, traffic channels and mediums, campaign data and user lifetime value
- User acquisition: first user medium: this data reveals the marketing channel via which users were first acquired. In here, you can see user acquisition data by user medium (at a high level and over time), as well as a full breakdown of traffic, engagement, events and conversions data by first user medium
- User acquisition: this report is very similar in content to the first user medium report, with the difference being that User acquisition focuses on default channel groupings rather than mediums. Find top-level and time-plotted data on new users by channel - plus a full breakdown of traffic, engagement, events and conversions by default channel grouping. Note: you’ll be delighted to learn that there are a range of new additions to the default channel groupings, taking a more granular approach to traffic attribution - with Paid Social and Organic Social, Paid Shopping and Organic Shopping, Paid Video and Organic Video, Affiliates and more joining these ranks. Find a full list here
- Traffic acquisition: again, this report bears many similarities to the two preceding sections. This time, though, data revolves around sessions rather than users - with channels being the primary dimension, as with the User acquisition report
Engagement
These crucial reports measure user engagement based on the pages and screens accessed by users and the resulting events and conversions completed during their session.
In the real world, this could translate as a brand who is investing significant resources into blog content creation and they need to understand whether content is being read in full to give them a clearer picture of real engagement. Enter GA4’s engagement time and user scrolling measurement - not something that was available in UA.
This could be considered the flagship report within GA4, given that the new platform’s event focus defines this next generation of Google Analytics.
Within this area, the tabs you can access are as follows:
- Overview: this area provides a high-level summary of your website or app’s engagement data. Think of it as a teaser of the other more granular reports within the Engagement section of GA4. Find metrics including average engagement time, engaged sessions per user, and average engagement time per user, views and event count - plus user activity and stickiness over time
- Events: GA4 events measure user interactions with your website or app, and the Events report is the central hub of this important data. Find automatically collected events, and, if applicable, enhanced measurement events here - with event data including session source/medium, event count and associated revenue. Event options include first_visit, begin_checkout, purchase and many, many more
- Conversions: Event name: in GA4, the distinction between goals and ecommerce is gone - instead, events measure just about everything, including all of your conversions. In this report, conversions are recorded along with their associated event name (and revenue where applicable). As standard, you can see a breakdown of conversion events by session source/medium, but this dimension can be customised to your heart’s content for more bespoke reporting
- Pages and screens: with the advent of combined web and app reporting, this subsection of the Engagement area focuses not only on pages or screens but a combination of the two. If, of course, you’re tracking web data only, think of this as your page views area. Find details of views and number of users by page title or screen class, plus a complete breakdown of traffic, engagement, events and conversions by page title or screen class
Monetisation
Show me the money!
It’s all about the revenue in your Monetisation reports, which is home to data on all revenue generated via products, subscriptions and advertising.
Beyond that, though, you can also dig into data on viewed items to gain an understanding of products users popularly browse - separate to actual purchase data.
Here’s a closer look at what you’ll find within the Monetisation reports:
- Overview: once again, this is your quick snapshot of the more granular data found within the Monetisation area. Find a selection of widgets showing top-level revenue data at a glance, including details of total revenue (and, specifically, ecommerce and ad revenue), number of purchasers (including first time purchasers), average revenue per user, and ecommerce purchases by item name - plus data on coupons and promotions, and revenue via ads and in-app purchases
- Ecommerce purchases: find everything you could possibly want to know about your ecommerce purchases in this self-explanatorily named GA4 report. Access data on items viewed, added to cart and purchased, as well as insightful new metrics such as cart-to-view rate and purchase-to-view rate. These new additions will allow you to quickly and easily measure customer drop-off and identify high and low-performing products in the sales stakes
- In-app purchases: if you’re measuring app performance in GA4, this is where you’ll find a comprehensive breakdown of revenue by product ID for your in-app purchases. This report breaks down the quantity and associated revenue of in-app purchases, as well as providing details of average product revenue
- Publisher ads: remaining in the world of mobile apps, this final Monetisation report measures revenue generated via ads within your mobile app. Find ad impressions, clicks and revenue data grouped by ad unit
Retention
This final area of the Life cycle reports looks at how users engage with your website or app beyond their first visit. This gives you an indication of the extent to which you’re retaining these users.
In here, you can compare new and returning user data, plus user retention and engagement data by cohort and, of course, the lifetime value of your users. Together, this data paints a picture of your website or app’s ability to engage users in the long term.
User
This group of reports shares the data you need to get to know the people who use your website or app with a view to better attracting and engaging high-converting users.
Demographics
First up in the User reports, there’s Demographics - a selection of data that will hopefully be very familiar to you from the good old days of Universal Analytics.
These reports break down user classifications based on their identity and browsing behaviour, and are split as follows:
- Demographics overview: this top-level look at user demographics for your website or app includes a snapshot of user geo data (at a country and city level), languages, ages, genders and interests
- Demographics details: in this more granular breakdown of user demographics data, the default dimension is the user’s country. In the table below, though - which provides details of traffic, engagement, events and conversions by user type - this dimension can be replaced with any of the other available options (region, city, language, age, gender and interests)
Tech
Closing out the User reports is the Tech section, which sheds light on the various hardware and software via which users have accessed your website or app.
In the Tech report, you’ll find the following:
- Tech overview: in typical overview style, the Tech overview section delivers an at-a-glance snapshot of data on user technology - including platform, device type, browser, operating system, screen resolution and app version. As always, each of these widgets comes with a quick link to the granular version of the relevant report where you can dig deeper into the applicable data
- Tech details: this report shows data by browser as standard but can be customised to display data for the tech-related dimension of your choosing. Find a comprehensive breakdown of traffic, engagement, events and conversions data relating to your chosen dimension to identify highest performing device types, browsers, operating systems and more
But that’s not all.
Outside of the Reports area, there are three key tools you can use to dig deeper into your data and level up your reporting.
Here’s what you can expect from these tools:
Explore
This extremely useful area of GA4 houses a collection of advanced methods for cross-referencing and visualising your web and app data - that is, if the basic reports available to you just aren’t cutting it when it comes to granular data dissection.
You can start from a blank canvas and build your data on top (applying any segments, dimensions and metrics your heart desires), go free form, or choose from Google’s selection of preset formats.
Explorations enable bespoke, ad hoc data comparisons where you can drill down to a deeper level than in standard reports in a format that suits you, and export any data from the Explorations you create.
Advertising
The Advertising workspace within GA4 gives you an overview of sales attribution, including performance by channel and paths to conversion.
Here’s a breakdown of this area:
- Advertising snapshot: find top-level data including conversions by channel, paths to conversion and advertising-specific Insights on data trends for your chosen date range
- Model comparison: compare attribution models with a look at conversions and revenue by channel. As standard, the two comparative models are the last click and data-driven models - but as with all things GA4, these can be customised as you like depending on the comparisons you want to see
- Conversion paths: explore how users are nurtured from initial contact through to conversion by investigating touchpoints throughout the user journey and the channels that contribute most to your conversions
Configure
Last but not least, there’s the all-important Configure workspace where events, conversions, audiences and custom definitions are created - and debugging is performed in real-time.
- Events: create and modify bespoke events to track the user engagements you’d like visibility of in your GA4 reports
- Conversions: create new conversion events separate to the standard purchase event for more granular reporting on user buying behaviour
- Audiences: create audiences to segment your users based on relevant classifications to gain deeper insights and improve your future marketing activity’s success
- Custom definitions: create custom dimensions and metrics to go even deeper with your data gathering
- DebugView: like UA’s real-time reporting but better, GA4’s DebugView allows for the internal monitoring of data by isolating your own data from that of genuine users (when debug mode is enabled on the relevant device, that is)
How to find your favourite Universal Analytics dimensions, metrics and tools in Google Analytics 4
Looking at this dramatically reimagined report structure might have you sweating over the idea of losing access to the trusty dimensions, metrics and tools you swear by in UA.
Fear not, brave data analyst - nestled within GA4’s new structure, you’ll find relatively easy access to an all-star lineup of your go-to metrics and more from the golden age of Universal Analytics.
Here are some of UA’s most popular dimensions, metrics and tools, and where you can find them in GA4:
- Users: head to Acquisition then either Acquisition overview (to see Users and New users in the very top scorecards) or Traffic acquisition (to see Users in the first metrics column in the table below)
- Sessions: head to Acquisition then Traffic acquisition (to see Sessions in the first metrics column in the table below)
- Pageviews: head to Engagement then Pages and screens (to see Views in the first metrics column in the table below)
- Bounce rate: congratulations - bounce rate is being rolled out in GA4 as of July 2022 (presumably as a response to widespread public outrage following its omission from the original iteration of the platform). However, it won’t be available in standard GA4 reports, so you’ll need to create an Exploration or custom report to find your beloved bounce rate (which is defined as the opposite of engagement rate, and calculated based on sessions where no events were completed)
- Average session duration: head to Engagement then Overview (to see its replacement metric, average engagement time, in the very first scorecard) or Pages and screens (to see average engagement time in the fifth metrics column in the table below)
- Audience demographics: head to User then Demographics overview for a comprehensive snapshot of user demographics data, including age, gender, location and more
- Conversion rate: as with bounce rate, conversion rate is another metric being rolled out in GA as of July 2022. We expect this metric to be available via the Engagement > Events and Monetisation > Ecommerce purchases reports. Watch this space!
- Average order value: this metric is now known as average purchase revenue. You can quickly and easily access the slightly different metric, average purchase revenue per user, by heading to Monetisation > Overview. Of course, this is an average value per individual user - to access the overall average order value metric, you’ll need to create an Exploration and add average purchase revenue as your metric of choice
- Custom segments: replaced by ‘add comparison’ (can be done in any report) - set dimension and associated parameters/conditions
Are we migrating for better or worse?
We know - change is scary. We wouldn’t be the first to admit we weren’t exactly throwing a street party at the prospect of leaving our precious UA behind and learning to love GA4.
There are also a few undeniable drawbacks to this transition - at least in the short term - but there’s every reason to be optimistic about the future that GA4 is carving out before us.
We’d like to take a balanced view to assessing the next gen of Google Analytics, so we’re giving you the scoop on the admitted drawbacks and undeniable benefits of embracing this migration:
The drawbacks
- Steep learning curve: this is the biggie. With a whole new interface to contend with (which, at first glance, will seem less user-friendly purely due to its unfamiliarity), as well as a raft of new metrics to get to know, there’s no getting around the fact that initiating yourself in the ways of GA4 will take significant time and effort
- Loss of historical data: this is a tragic loss for data analysts across the globe. Six months after deadline day, Universal Analytics properties will become defunct and all of their historical data will be lost - making it essential to export the historical data you want to access at any point in the future
- Complex migration: we’ll take you on a quick tour of the migration process in a few short moments, which will highlight the complexity of this process. There are a fair few steps involved and we’d expect it to take some time - so strap in for the big migration
- Goodbye, goals: in the age of events, goals will become a thing of the past and the actions that once constituted goals will now be classed as events. While this marks a shift towards greater uniformity and clarity in data reporting, there’s no doubt it’ll take a while to warm to this new event-centric world we’ll all be born into come deadline day
- Platform newness: the GA4 platform is still in its relative infancy, which means there are new changes coming all the time. This will make it something of a baptism of fire, as you continually adjust to this evolving suite of tools and the dimensions and metrics contained therein
- Au revoir, views: in the free version of GA4, you won’t be able to create custom views within your GA4 property. Instead, you’ll simply have a single property within which you can perform various comparisons and create Explorations filtered based on your chosen segments, dimensions and metrics
The benefits
- Quick, easy tracking implementation: Google Tag Manager users, rejoice - GTM has its own GA4 configuration tag which functions similarly to the global site tag and fires first on every page. This should make the process of implementing your tracking relatively simple and stress-free
- AI-powered data predictions: Google Analytics is more powerful than ever in its fourth iteration, with machine learning driving valuable insights on your users and their likely behaviours. In Google’s own words, it “automatically enriches your data by bringing Google machine-learning expertise to bear on your dataset to predict the future behavior of your users” - with AI-driven example metrics including purchase probability and predicted revenue
- More robust event tracking: with a multitude of automatic events providing granular insights into the user journey through your website or app, plus the near-infinite possibilities that come with custom events, it’s safe to say GA4 has really upped the ante when it comes to event reporting
- Enhanced customer journey insights: with a report structure based around the customer life cycle, GA4 is designed to illuminate the user journey through your website or app from initial acquisition through to conversion and beyond. This more focused structure should serve to provide not only more granular data on how users engage with your business, but also a broader understanding of your sales funnel
- Cross-platform analytics: one of the big changes in GA4 comes in the form of cross-platform tracking within a single property, allowing for web and app performance measurement within one convenient workspace
- Enhanced integration access: from Google Ads, Search Console and Merchant Center to the almighty cloud data warehouse that is BigQuery, GA4 provides a range of more sophisticated integrations than were previously available. Better yet, these integrations are free and available to all Google Analytics users
How to make the move to Google Analytics 4
OK - on to the all-important matter of your GA4 migration.
This may seem like a daunting process at first glance - and we must warn you it’s likely to be a time-consuming endeavour. But the good news is, by following these steps, you can enjoy peace of mind that your migration has been a success.
1. Export the UA data you’ll want to access later
First things first: you’ll need to export all of the historic Universal Analytics data you think you’ll need as a means of comparison going forward into your GA4 future.
Deciding which data qualifies is a task in itself, given that any data left behind will be lost in the void following deadline day. Our recommendation is to be liberal in your data exporting, and leave no stone unturned.
At a minimum, we’d expect you’ll want month-by-month traffic, engagement and sales data for the last several years by channel, device category and your favourite user demographics.
Make sure to store your exported data in a set of clearly labelled folders and spreadsheets so it can be accessed quickly and easily when you need to call upon it for crucial historic comparisons.
2. Document your UA settings
With your crucial historical data exported, you’ll need to make a record of your existing Universal Analytics settings so these can be replicated in your new Google Analytics 4 account.
Important settings to review and record include the following:
- User access
- Referral exclusions
- Goals
- Events
3. Plan your GA4 account structure
Next, you’ll need to plan the structure of your new Google Analytics 4 account.
If your business doesn’t belong to a parent company, this should be a pretty straightforward account > property setup. If, however, your brand sits under an umbrella company, your enterprise company will sit at the account level with separate properties for each subsidiary.
4. Create your property and data streams
The next important step is to create your Google Analytics 4 property. If you have an existing Universal Analytics property, simply navigate to Admin and, within the appropriate UA property, choose the GA4 Setup Assistant option and then opt to ‘get started’.
If you’re using a gtag.js tag, you can choose to enable data collection using your existing tags (simplifying the migration process). With that done, you can create your property.
If, later on, you’re looking to create an additional data stream, you can do this by going to Admin > Property > Data Streams and choosing ‘add stream’ - then select iOS app, Android app or Web and follow Google’s helpful setup instructions as appropriate.
5. Enable data collection
There are four ways to set up data collection via GA4 for your website, depending on your preferred method and the platforms you’re working with. These are as follows:
- Add your GA4 tag to a website builder or CMS-hosted website (such as Shopify or WordPress). Google provides specific step-by-step instructions for individual platforms here
- Add the entire global site tag directly to the <head> section of your web pages
- Add your tag using Google Tag Manager. Again, Google has been kind enough to provide in-depth instructions as to how to complete this tagging - which you can find here
- Find your "G-" ID (for any platform that accepts a "G-" ID)
You can locate your global site tag and, within that, your G-ID by going to Admin within GA4, then Data Streams and choose the appropriate data stream for which you’d like tracking to be in place.
To enable basic data collection for an app once you’ve followed Google’s instructions on app property setup, simply add the Google Analytics for Firebase (GA4F) SDK to your app. With this in place, a number of events are collected automatically - but there’s also the option to collect additional events that are relevant to your business.
6. Activate Google signals (if applicable)
Activating Google signals is essential for reporting on cross-device journeys and for remarketing to logged-in Google users - but be warned you’ll need Editor access to the relevant property in order to complete this activation.
The process is as follows:
- Go to Admin and navigate to the relevant GA4 property.
- Go to Tracking Info, then Data Collection.
- Click ‘GET STARTED’ and follow the dialogue prompt.
- Click through the information and activation panels, then click ‘CONTINUE’ once you’ve read through the informational content around Google signals.
- Activate Google signals, selecting the appropriate properties and choosing to activate immediately unless you’d like to make the decision to activate at a later date.
Following this activation, you should be able to find user data in the Cross Device reports (Device Overlap, Device Paths and Acquisition Device - in the Audience area of GA4).
7. Link to other tools
The next step is to connect to any other relevant tools you want linked to your GA4 account in order to share data between platforms for more accurate or in-depth reporting.
These might include the following:
- Google Ads: the process laid out by Google is different depending on whether you’re looking to update existing Analytics and Ads links or create new links between your GA4 and Ads accounts
- BigQuery: this process is somewhat more complicated. Thankfully, it’s Google to the rescue with their step-by-step guide to linking GA4 and BigQuery
8. Migrate UA events
These next two steps in your GA4 migration journey are utterly crucial to accurate reporting and, frankly, warrant their own post entirely.
Google recommends using dual tagging with the help of your global site tag. This presents a relatively straightforward way to build a bank of historical GA4 data as soon as possible, while keeping your existing Universal Analytics tracking in place until deadline day.
There are two ways to approach your dual tagging:
- Use Google’s GA4 Setup Assistant and choose to ‘Enable data collection using your existing tags’
- Add a new manual ‘config’ directive using your GA4 ID (G-XXXXXXXX)
Google provides very in-depth guidance on how to master event migration in GA4, which it’s worth having on standby throughout this part of the process.
9. Migrate goals and ecommerce tracking
This one’s a serious undertaking given that UA’s traditional ecommerce tracking has been replaced with an events-centric structure in GA4.
Turn to Google’s comprehensive guide to conversion events and parameters for an exhaustive list of recommended events and associated details.
What’s important to note before you commence your ecommerce tracking migration is that, in order to enjoy the best of both worlds while your UA and GA4 properties are running in tandem, you should:
- Leave your UA implementation as is
- Create new duplicate events for your GA4 property
10. Import GA4 conversions to Ads
For maximum accuracy and uniformity in tracking from Google Analytics to Ads, it’s important to import your shiny new GA4 conversions into the Ads platform.
It’s key to demote your UA conversions to secondary versions and set your new GA4 conversions as the primary conversions so that you’re focusing on the next-gen metrics that matter. You can find out how to do both right here.
Before you begin the conversion import process, though, you’ll want to compare values from across UA and GA4 to validate the accuracy of your recently implemented conversion tracking.
You may want to leave a period of a couple of weeks or so after implementing your tracking before making these comparisons. This will ensure you have a sufficient sample size from across the two properties to compare.
11. Migrate audiences
Any audiences you have set up in Universal Analytics allow you to perform granular data analysis and, in turn, more targeted marketing activity. Importing these audiences means you can pick up right where you left off with this strategic segmentation.
The bad news is that the import process actually involves manually recreating these audiences in Google Analytics 4 - but for businesses with few custom audiences set up, this should be a relatively quick and straightforward process.
Where these audiences are based on custom dimensions, these too will need to be recreated within GA4 in order to provide a basis for your audiences.
Note: you can create up to a maximum of 100 audiences in a single Google Analytics 4 property.
12. Update user access
With all of your tracking migrated from UA to GA4, virtually all that remains is the updating of your user management settings for this new property.
Google has its own user migration tool which can make light of this work in scenarios where there are varying settings for numerous users to be recreated in GA4.
Where these settings are quick and easy to replicate, this can, of course, be done manually via the Access Management area within Admin.
13. GA4 team training and upskilling
The final crucial step is initiating your team on the inner workings of Google Analytics 4, from its overall reports structure and reimagined metrics to its tracking conventions and the new reporting possibilities made a reality in this next-gen platform.
We expect this final step will be an ongoing endeavour for months if not years to come, given the departure from the cosy, familiar Universal Analytics. But from what we’ve seen in Google Analytics 4 so far, the result for you and your team will be empowered data analytics the likes of which we’ve never seen before.
Note: Google Analytics 4 is still a work in progress, and most likely will be for some time.
As new metrics and functionality are rolled out, the platform will evolve and change shape into something that, in some ways, will bear little resemblance to our beloved UA, but will be capable of more powerful data reporting than we thought possible.
With any luck, these ongoing developments will delight and empower millions of novice GA4 users across the globe.
Watch this space - we know we will be.
If the migration process sounds like something you’ll need help with, we’d love to help demystify this process for you and support you in making the big move. Get in touch today by popping us a message or calling 0191 511 1014 and we’ll take it from there.
Otherwise, godspeed in your quest.